![]()
Pie-in-the-sky charts
Richard Law, UTC 2017-01-19 17:59 Updated on UTC 2017-02-04
Here is some information about energy use in the United Kingdom at 16:15 on 17 January 2017, captured from Stephen Morley's excellent National Grid Status website.
The display there is interactive and the data is updated at five minute intervals. I thought it might be helpful to freeze a snapshot at a particular moment and have some time to consider what we are being shown. This particular date and time has not been cherry-picked to prove a point: the situation at the time of writing is even more extreme.
At 16:15 on 17 January 2017 the average temperature in the UK was around 0°C, depending on where and when you measured it. Fortunately, many people do not (yet) rely on electricity for cooking, heating or transport, but the 'decarbonisation' of energy foresees a withdrawal from all forms of fossil fuel use. As far as electricity generation is concerned, the date set for complete decarbonisation is 2030. Citizens of Britain – of whom, fortunately I am not one – you still have 13 years to achieve this goal! It will probably only cost you 24 billion GBPper year to do this, assuming of course that someone works out how to do it.
Let's see what energy sources were being used on that day. [In the following account, percentages have been rounded appropriately in the text for ease of reading, accurate figures are on the charts.]
Production proportions
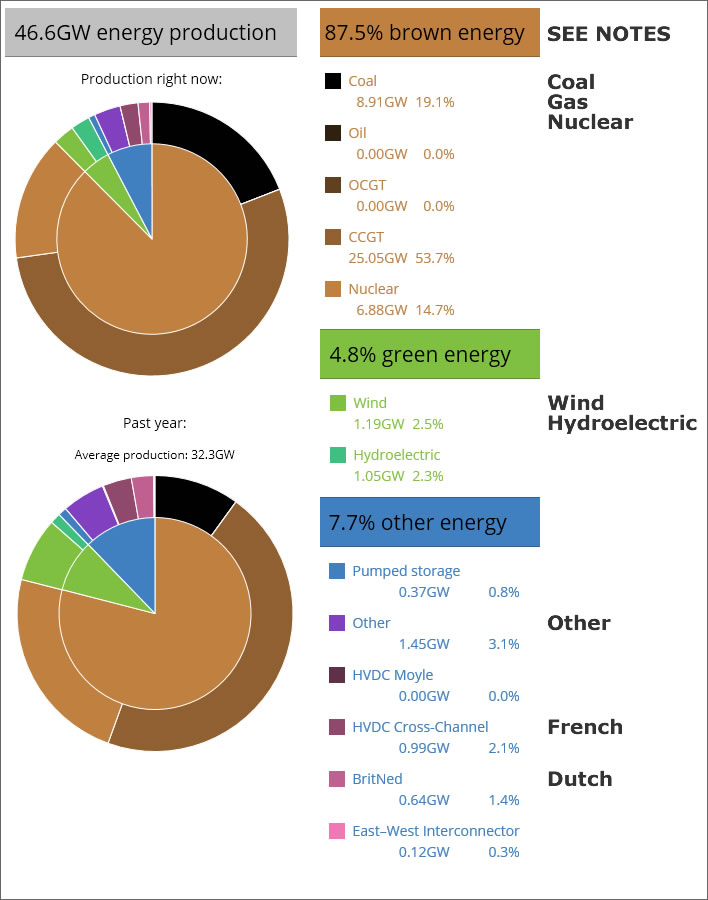
- Nearly 90% of all electrical energy came from gas (50%), coal (19%) or nuclear (15%) power stations.
- 'Green energy' supplied just under 5% of electrical energy, half of this from wind and half from hydroelectric generation. At 16:15 on 17 January 2017 all the wind farms in the UK were supplying just 2.5% of the total energy produced.
- In these charts the 3% power listed under 'Other' includes solar, biomass and all the other exotics. At 16:15 on a cloudy day in midwinter we can safely state that solar output was somewhere between meaningless and 0%.
- 'HVDC Cross-Channel' is a cable under the English Channel that connects France and England. It has a capacity of 2GW (about 4% of today's requirement). At this moment it is delivering 1GW, about half that capacity from France to the UK and supplying 2% of UK consumption.
Small update: four of the eight cables making up this link were severed by a ship's anchor in November 2016, halving its capacity. The 1GW it was delivering is therefore its total operating capacity. - 'BritNed' is a cable between England and the Netherlands with a capacity of 1GW. It was also at this moment running at about half its capacity.
- The pie-chart at the bottom shows the situation for the past year, which, for an average production of 32GW, 14GW less than today, the contribution of 'green energy' is only marginally better than today.
The UK has committed itself to the goal of 'decarbonisation' by 2030. For UK citizens there is much harmless fun to be had by showing these charts to their elected representatives and asking them politely how they intend to replace those troubling dark brown and black parts with green. Oh, not forgetting fossil fuels used for heating, cooking, transport and so on, but that's a separate issue.
Day and week
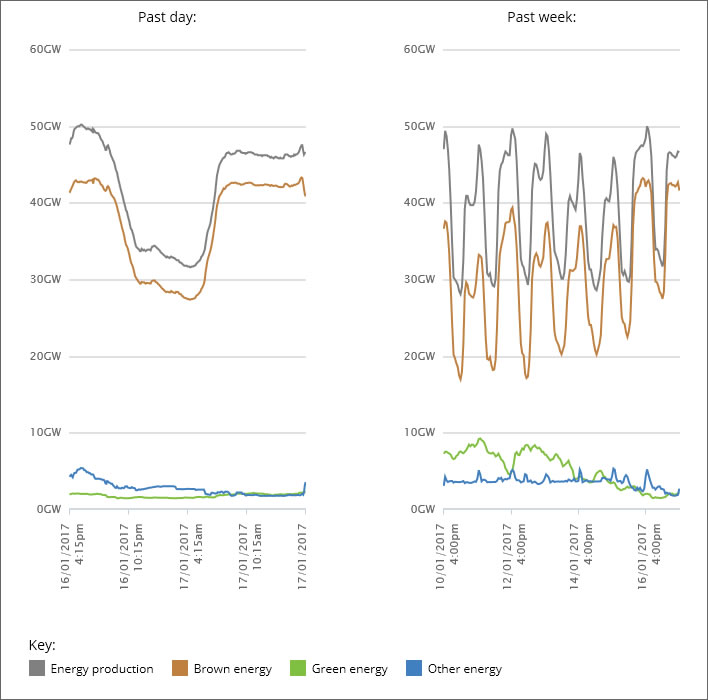
The chart on the lefthand side shows the energy production for the past 24 hours, that is, from 16:15 on 16 January 2017 to 16:15 on the 17th.
- Overnight the production of brown energy – coal, gas and nuclear – is sharply reduced. The trivial amount of green energy – wind and hydroelectric – remains constant. Other energy – solar, biomass etc. and connectors – varies insignificantly.
- The total contribution of green energy to energy production is trivially small.
The chart on the righthand side shows the energy production for the past 7 days, that is, from 16:00 on 10 January 2017 to 12:00 on the 17th.
- The lower total demand at the weekend (14/15) is noticeable.
- Windier weather increased the output of wind energy in two bulges during the first half of the period. Brown energy takes up the load as the wind output falls. Variability and unpredictability, the problems of wind and solar.
- The blip in the output from 'Other' sources on 16th, also visible at the start of the graph for the day, suggests a sunny day. With or without sun, the contribution of 'Other' is also trivially small over the period.
Month and year
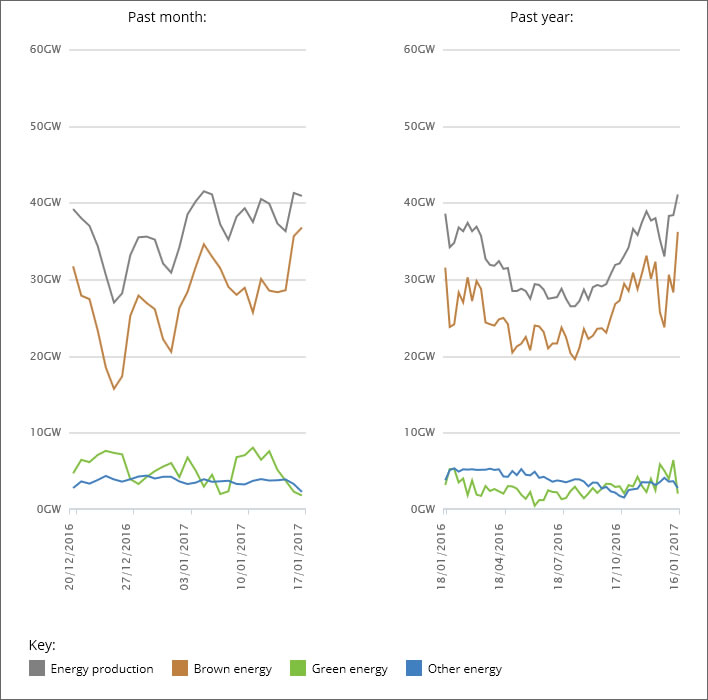
The chart on the lefthand side shows the energy production for the past 28 days, that is, from 20 December 2016 to 17 January 2017.
- This chart reinforces the madcap unpredictability of wind. Note that the green line includes hydroelectric, a fundamentally constant source, so the variability occurs even with this smoothing.
- The green peak around the 12th has forced a marked drop in brown output – for a day.
- There is a dramatic reduction of demand over the Christmas period, followed by a peak on the first general working day.
The chart on the righthand side shows the energy production for the past year, that is, from 18 January 2016 to 17 January 2017.
- The windy peaks of the winter storms are evident at the start and end of 2016 and the beginning of 2017.
- On this scale, the drop in demand over the Christmas season is particularly pronounced.
- As the warmists keep reminding us, 2016, a great El Niño year, was warm.
We can take many lessons from these charts. The fickleness of wind is obvious and thus the need for a controllable energy source to fill in the gaps is equally obvious. Reality also speaks to those who think that green energy can be stored in batteries and released on demand: it cannot, because it is obvious that green power never generates any surplus that can be held back in storage. If you hold it back, you have to make up the defict from brown energy. Whether they will ever listen to this reality is doubtful.
Anyway, better get a move on with that decarbing stuff – ticking clocks and all that.
Update 25.01.2017
Just in case anyone thinks the point in time shown above was cherry-picking, here are four further samples taken between Sunday 22 and Monday 23 January 2017.

Update 04.02.2017
Just in case your sleep was troubled wondering what wind farms were doing during the Christmas demand slump (see 'month and year' chart above), here is the answer: they – at least the Scottish ones – were making a lot of money for supplying unwanted electricity.
Over the Christmas period, high winds accompanying Storms Barbara and Conor combined with low demand for electricity to deliver a £7 million gift to the owners of wind farms in the form of constraint payments. Constraint payments occur when wind farms are paid not to generate, usually in periods when wind generation is surplus to demand. The bulk of these payments are made when wind generation cannot be used in Scotland, and there is insufficient grid capacity to export the energy to England. The cost of these payments is borne by electricity bill payers throughout the United Kingdom.
The peak payments over the current holiday season were made on Christmas Day, as summarised in the following table drawn from the REF datasets:

Table 1: Constraint payments made to wind farms over the Christmas holiday period 2016
The big earning companies were Scottish Power (SP) and Scottish and Southern Electricity (SSE) which made £3.5 million and £2.5 million respectively over this period. Whitelee (owned by SP) and Clyde (SSE) were the most heavily constrained taking £1.9 million and £1.2 million respectively, but 35 wind farms in total shared in the windfall […]
0 Comments
Server date and time:
Browser date and time:
Input rules for comments: No HTML, no images. Comments can be nested to a depth of eight. Surround a long quotation with curly braces: {blockquote}. Well-formed URLs will be rendered as links automatically. Do not click on links unless you are confident that they are safe. You have been warned!