![]()
Swiss Government-sponsored CAGW alarmism
Richard Law, UTC 2018-01-18 10:22 Updated on UTC 2018-01-30
His Master's Voice
Like so many national meterological institutes around the world, the Swiss Federal Metorological Office (MeteoSwiss) is concentrating more and more on climate alarmism. We cannot really blame them: that is where the money is these days – lots of it.
Like so many climate scientists, the people at MeteoSwiss cleave to the consensus conclusions that are expected of them by the source of their funding. 'The Moon is made of blue cheese? Of course it is. For another couple of million we might make some progress towards telling you whether it is Rocquefort, Gorgonzola or Stilton. Do you have a preference, by the way?'

An allegory of climate science research by Francis Barraud (1856-1924) (1898). The image shows a dog called Nipper, who belonged to Barraud's brother, representing climate scientists receiving their instructions from the giant horn of Big Green.
Despite years of growing cynicism, it still comes as a shock when we read some of the feeble falsehoods and strong misdirections that 'scientists' – or the 'communicators' who represent them to the public – serve up to the laity: artfully constructed graphs and diagrams that make the situation appear as dramatic as possible. This is not science, it is activism, pure and simple.
Climate Facts – not really
MeteoSwiss has just introduced a reworked 'climate' section on its website. It is full of the usual claptrap and would really not be worth bothering with – were it not for the fact that the production of this nonsense is largely funded by the taxpayer. In these days of 'fake news' and 'fact-checking' it has a section it calls 'Climate facts – the main points in brief'.
It has to be said first that if these twelve statements are really the most important things to be said about climate change then we can sleep soundly in our beds, at least until MeteoSwiss can think up some really important things. The first item on their list, though, did stand out as a contender for the most pathetic climatological argument of 2018.
The summary statement is:
The rise in the global mean temperature from the middle of the 20th century up to today is unequivocally the result of anthropogenic greenhouse gas emissions
Not 'partially due to' nor 'to some extent due to' but 'the result of', and 'unequivocally' at that. This level of certainty over this degree of attribution is a bit of a surprise, to put it mildly. Not to worry: a click on the statement shows us an explanatory text:
There has always been climate change, even before humans existed. A number of different factors contributed to it: Changes in solar activity, volcanic eruptions and many other natural factors. Increased emissions of greenhouse gases are the main cause of the rise in the global mean temperature of the last 50 to 60 years. In the context of the earth's history, natural factors cannot explain the extraordinarily rapid warming in the 20th century.
There is so much wrong with these texts that it can only be assumed that they were just some preliminary products – discarded and now reused – of Swiss monkeys attempting to type the works of Shakespeare (in four languages, of course).
Where on earth do we begin with this rubbish? We could express dismay at the sloppy use of the term 'global mean temperature', the coy use of the plural term 'greenhouse gases' when they really should write just 'carbon dioxide' – but the MeteoSwiss authors know that bigging up the effect of a single trace gas in this way would just make them look silly. We are amused to find that the justification for 'unequivocally the result of anthropogenic greenhouse gas emissions' and 'the main cause' is one evidence-free statement: 'natural factors cannot explain the extraordinarily rapid warming in the 20th century'. We are shocked that the headline 'climate fact' with its 100% certainty of 100% attribution of human causation is directly contradicted by the expanded text – 'the main cause' – that is supposed to explain it.
We could play MeteoSwiss's game here and quibble about the numbers behind that 'extraordinarily rapid warming', numbers that are routinely reprocessed to give ever steeper temperature trends, numbers, some of which come from entire continents with barely a measuring station on them. Despite all objections MeteoSwiss is still mendaciously propagating the ridiculous WMO temperature normals series as evidence for CAGW elsewhere on its climate pages.
We could quibble about cherry-picking the terminal points of measurement series, especially beginning series in the middle of a cold snap and ending in an El Niño year. We could hunt around paleo-temperature plots created from various proxies to find something that might be steeper, but we would never find anything comparable, since the resolution of these series is usually nowhere near 50 years.
This search would anyway be a pointless activity, a waste of time since the scientific basis of the argument is completely bogus: if you can't account for this alleged temperature rise with natural factors (which are themselves only vaguely understood) then just attributing the bit you can't explain to human emissions of carbon dioxide is – let's say it again – completely bogus.
Carbon dioxide sensitivity – the only thing that matters
On this website we have repeated our view time and time again: the only thing that matters in this debate is the so-called 'climate sensitivity' of carbon dioxide. As we have mentioned, carbon dioxide is what is really meant by the weasel phrases 'greenhouse gases' and 'human emissions': let's first of all start by calling a spade a spade.
Temperature series, whether recent, historical or paleographical, have nothing to say here. They are interesting in many respects, but meaningless in respect of carbon dioxide as a cause of warming. Paleographic proxy derivations of the temperature and the carbon dioxide content of the atmosphere do not correlate in any consistent way.
The link between real-world atmospheric temperature and carbon dioxide has to be established scientifically. Where there is occasional correlation, it does not prove causation.
What has been established scientifically, again and again, however much the activist monkeys at MeteoSwiss close their eyes and cover their ears is as clear as day: carbon dioxide has as good as NO influence on atmospheric temperature.
Now there are many people interested in this field who will regard this statement as an outrageous, anti-science heresy. Our response is: it is perfectly clear that in a spectrophotometer carbon dioxide absorbs radiation of a certain, very restricted range of wavelengths. It warms (a little bit).
But what happens in the mind-boggling compexity of the real atmosphere is another matter altogether. CAGW theory always requires some little bit of feeble warming by carbon dioxide to trigger something else – usually water vapour – which then ditto ditto and the next thing you know is that northern Norway has become a major producer of champagne and southern Europe is incapable of supporting life.
Declaration of interest: your author finds the prospect of the rip-off specialists of the French Mediterranean coast being turned into pillars of glowing charcoal rather heart-warming – Norwegian champagne, less so. Never mind, back to climate science.
Climate sensitivity
'Climate sensitivity' is the measured and calculated effect of a doubling of carbon dioxide not in a laboratory instrument but in the real-world atmosphere. And as research has progressed over the last decades the value estimated for this climate sensitivity has got smaller and smaller. Here is a representation of those research results, brought up to date:
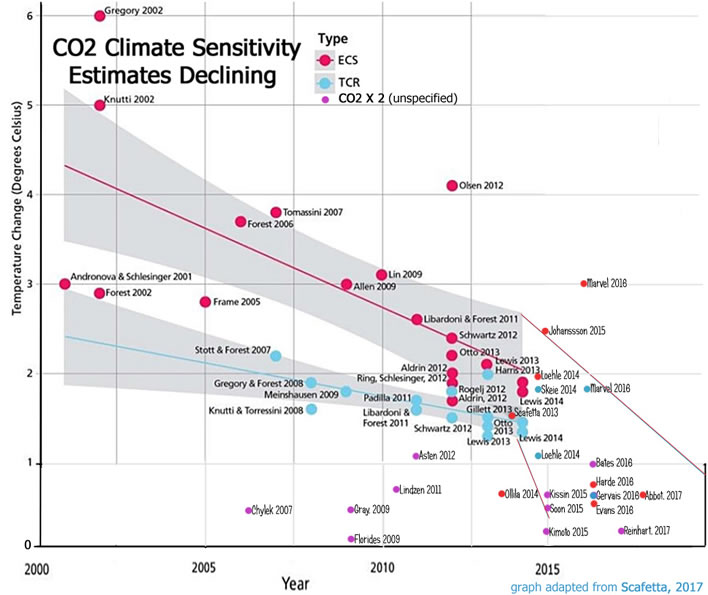
Base graphic adapted from fig. 7 in Scafetta, Nicola & Mirandola, Aberto & Bianchini, A. (2017). 'Natural climate variability, part 2: Interpretation of the post 2000 temperature standstill'. International Journal of Heat and Technology. 35. S18-S26, online PDF. Updated by Kenneth Richard on 16 October 2017, in 'The Shrinking CO2 Climate Sensitivity', NoTricksZone.
In this chart we see results from dozens of peer-reviewed studies carried out by – let's not mince our words – the best brains in the weak field that is climate science. The clustering and uniform direction of these results gives us grounds for cautious confidence in them.
But this is science and so it is always possible that someone somewhere may come up with different values for carbon dioxide sensitivity, but it is reasonable to expect these to be within the scope of the known. Outliers, dramatically different values from the current, very low consensus, would raise eyebrows and be required to survive intense scrutiny in this competitive field.
The trend in these results is suggestive: the more we know about the climate sensitivity to carbon dioxide and the more we measure and calculate, the lower the value becomes. The estimate is now so low that the effect of a doubling of carbon dioxide on real-world global temperatures is below anything we could expect to detect among the noise of real-world weather phenomena. Let's be clear about this: the 'unequivocal' attribution by MeteoSwiss of the 'the extraordinarily rapid warming in the 20th century' to human emissions of carbon dioxide cannot possibly be true if the recent results for climate sensitivity are correct. It is, put crudely, bunkum in the service of propaganda.
We notice that the paragons of scientific rectitude at MeteoSwiss in their justification for the effect of human emissions of carbon dioxide on climate in their 'Climate Facts' do not mention climate sensitivity at all, this most crucial evidence. You don't think that might be because 20 years of research into the warming effect of carbon dioxide has given us the opposite result altogether – a result that does not accord with the story they are trying to spin us? Surely not!
An important and easily overlooked aspect of the progression of research results illustrated here is that the two measures, the 'transient climate response' (TCS), that is, the short-term warming effects of carbon dioxide and the 'equilibrium climate sensitivity' (ECS), that, is the long-term warming effects allowing for the decay of the gas in the atmosphere assuming the emissions cease, gradually move together.
This leads to various subtleties, but the least subtle one is that if the effect of carbon dioxide is so weak, then it matters little how long it hangs around in the atmosphere. This is the reason that the two curves approach each other as the estimate is reduced. It is also one more reason why we can forget about the temperature effects of carbon dioxide – there aren't any worth thinking about.
Let's reiterate therefore with heads held high the only seriously scientific assessment – repeat: scientific assessment – resulting from all these heavyweight peer-reviewed papers of the effect of carbon dioxide on atmospheric temperature: carbon dioxide has as good as NO influence on atmospheric temperature.
Eyes have to be closed and ears covered, because this scientific statement invalidates all the political actions over several decades to reduce 'emissions': all the erratic renewable energy from wind and solar, the subsidies, the tidal barrages and ecologically questionable hydro-electric schemes, the felling of ancient forests around the world to burn as biomass, the smart grids and the smart meters, the exhortations to change our agriculture over to the production of tasty insects instead of tasty farm animals, the need to run our transport systems on pixie dust. All. Utterly. Pointless. And. A. Complete. Waste. Of. Trillions, Of. Dollars.
Carbon dioxide is your friend
However, the trace gas carbon dioxide has one huge and immensely critical effect on life on earth. If you want to know what it is you just need to ask the next green plant you meet. The current level of carbon dioxide in the atmosphere is around 400 ppm and as its concentration rises the plants on which life on earth depends get happier and happier at the increase in their food supply. The current concentration is trivially small – there have been times in the past when carbon dioxide concentrations have been in the thousands of parts per million.
During these times the earth did not boil or burn, but the result was an immense flourishing of the flora – and consequently of the fauna that depended upon it. Those who currently modishly wail about the loss of species should reflect that the greatest expansions of the variety of the species came at times when there were high levels of carbon dioxide in the atmosphere and life on earth was flourishing.
The low concentrations of carbon dioxide during ice ages say more about the plant life (on land and in the oceans – don't forget the ocean plankton) than the temperature of the atmosphere. A value of around 200 ppm of carbon dioxide in the atmosphere is literally verging on starvation for many plants – not shortage, starvation. During these periods of carbon dioxide starvation plant life on earth is a life and death struggle for food. If carbon dioxide were water, these plants would be attempting to live in the Sahara desert. Even where there is plentiful water and warmth, without sufficient carbon dioxide plants are literally starving. As the concentration increases, plants begin to flourish and their growth has more effect on the climate of the earth than carbon dioxide could ever have.
Nowhere in its 'Climate Facts' does MeteoSwiss mention the great beneficial and proven effects that increasing carbon dioxide is having on plantlife. Nowhere. Isn't that surprising? Where they do mention vegetation they focus only on flowering dates, which they use as a suggestive indicator of global warming.
The implicit view that MeteoSwiss takes is that in 1950 or even at the beginning of that magic 'pre-industrial' era in 1850 that we hear so much about, when lakes and rivers were frozen solid in winter, glaciers extended into the lower valleys and winters were long and stormy – these moments are therefore 'climate optima' to which we must somehow return. Bunkum!
When we look at the temperatures of the earth history as far as we know them, we find many periods of flourishing life in the interglacials where temperatures and carbon dioxide were a lot higher than today's temperatures. As we can see in the following graph, the current interglacial, the one in which we are living, is the coolest in the recent series, but historians still call the warm periods embedded within it times of 'civilisations'. The reader should take a moment to reflect on the terrible conditions on earth during those deep troughs.
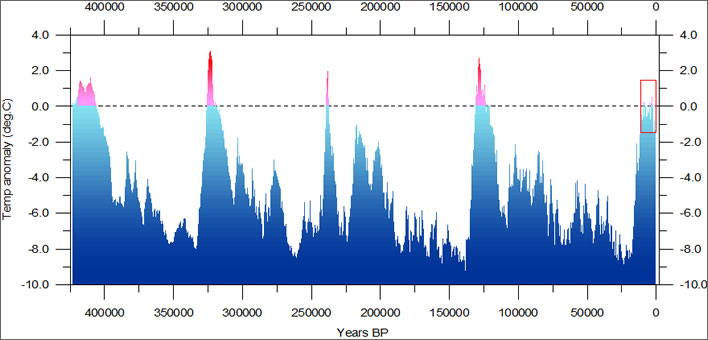
Our modern period is the little red blip at the righthand side of the red box.
[Prof Humlum's caption] Reconstructed global temperature over the past 420,000 years based on the Vostok ice core from the Antarctica (Petit et al. 2001). The record spans over four glacial periods and five interglacials, including the present. The horizontal line indicates the modern temperature. The red square to the right indicates the time interval shown in greater detail in the following figure.
Professor Humlum comments on this graph as follows:
The diagram above […] shows a reconstruction of global temperature based on ice core analysis from the Antarctica. The present interglacial period (the Holocene) is seen to the right (red square). The preceding four interglacials are seen at about 125,000, 280,000, 325,000 and 415,000 years before now, with much longer glacial periods in between. All four previous interglacials are seen to be warmer (1-3°C) than the present. The typical length of a glacial period is about 100,000 years, while an interglacial period typical lasts for about 10-15,000 years. The present interglacial period has now lasted about 11,600 years.
According to ice core analysis, the atmospheric CO2 concentrations during all four prior interglacials never rose above approximately 290 ppm; whereas the atmospheric CO2 concentration today stands at nearly 390 ppm. The present interglacial is about 2°C colder than the previous interglacial, even though the atmospheric CO2 concentration now is about 100 ppm higher.
From climate4you.com, Ole Humlum, Professor Emeritus - Department of Geosciences, The University of Oslo (UiO), Norway.
Carbon dioxide is your enemy – MeteoSwiss
In the fourth of their 'climate facts' the MeteoSwiss activists use all their skills of deception and misdirection in order to convince the plebs that carbon dioxide is the evil of the age:
In 2014, for the first time in about 23 million years, the global carbon dioxide concentration exceeded 400 ppm.
We, the carbon dioxide sane, knowing that the poor gas has a negligible effect on climate, lean back in our chairs and yawn: 'So what?' Let's see what the justification for this superficially alarming statement is when we click open the panel:
Carbon dioxide (CO2) blocks terrestrial out-going thermal radiation, which makes CO2 a greenhouse gas. Moreover, CO2 is very long-lived, as it reacts with hardly any other gases in the atmosphere and is also not washed away by rain. These properties make CO2 the most significant factor in the warming of the earth, which we have now been measuring for some decades. In 2015, humans emitted a total of 36.2 billion tonnes of CO2. In comparison with the natural outputs of carbon dioxide by oceans, soils, plants and animals, this is a relatively small amount (about 3%). However, the main CO2 sinks – plants and oceans – are not able to compensate for the anthropogenic excess. The global concentration is therefore rising continually. In 2014, the magic threshold of 400 ppm (0.04%) was exceeded for the first time in millions of years. Prior to industrialisation, the value remained at around 280 ppm over a period of 23 million years. New estimates, which the Intergovernmental Panel on Climate Change (IPCC) rated as reasonably reliable in their latest Assessment Report in 2013, indicate that the figure exceeded 400 ppm for short periods about 800,000 years ago. Continued unchecked carbon emissions would result in today's level being doubled (to around 800 ppm) by the year 2100.
Firstly, let us visualise what we are talking about. If the white background of the following diagram is taken to be the atmosphere, the coloured boxes represent the proportions of carbon dioxide we are discussing.
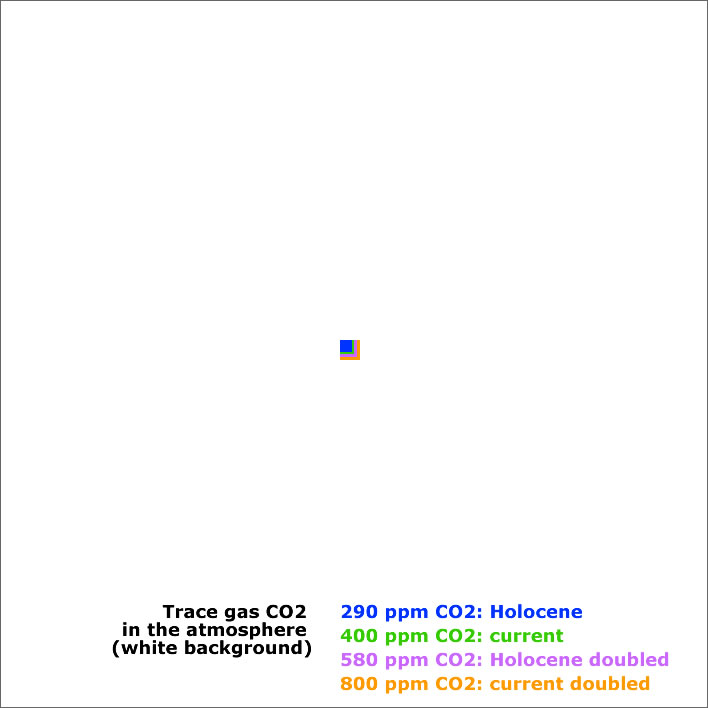
The atmosphere (white background) and the trace gas carbon dioxide at various concentrations. As far as an influence on temperature is concerned the danger the trace gas poses is not obvious. From a plant's point of view: bring it on! Image: Figures of Speech.
And then: 23 million years? Why that number? That blink of the eye in stratigraphic terms takes us back to the beginning of the Miocene epoch, conveniently leaving out a few hundred million years (depending how you want to specify the period) of life on earth when carbon dioxide levels were at times much, much higher than today. The vegetation of those times and the immense amounts of carbon dioxide that it absorbed gave us today's oil, coal and gas deposits. Ah, look! is this why they stop at 23 million years?:
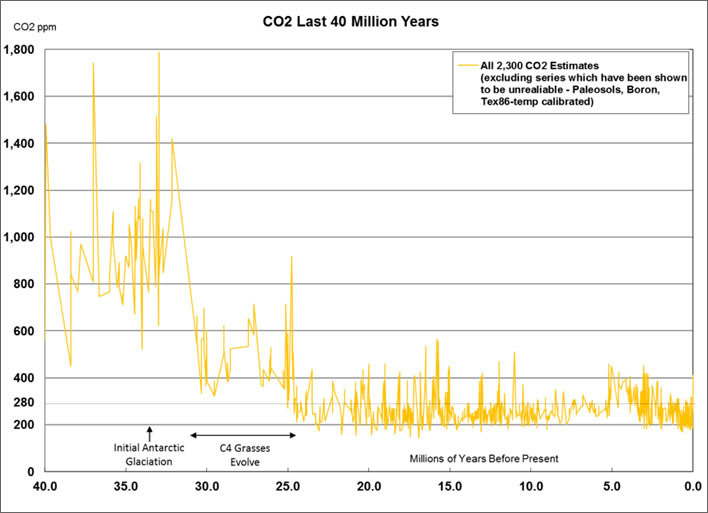
A compendium of estimates of carbon dioxide concentrations in the atmosphere over the last 40 million years. It's such a puzzle why MeteoSwiss only chose to go back 23 million years – who can explain it, who can tell you why? Image: Bill Illis, June 14, 2014, Watts Up With That?.
In geological terms the characteristic value for those 23 million years, 280 ppm, and the 'magic' level of 400 ppm are completely unexceptional. Why a concentration of 400 ppm should now be considered 'magical' we have no idea.
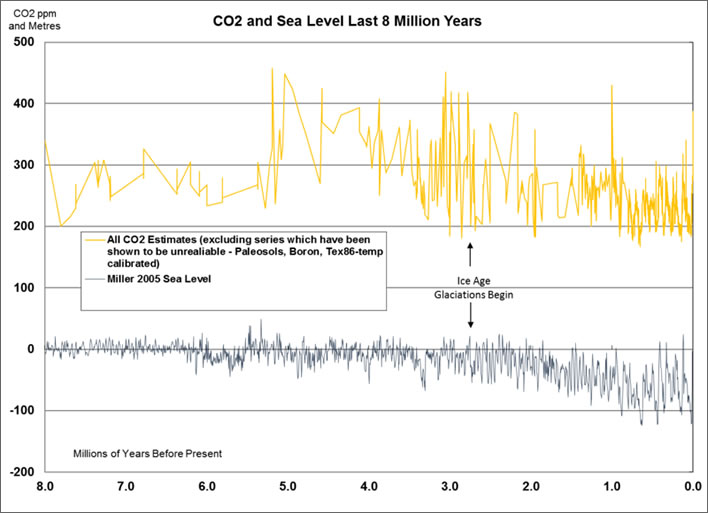
A compendium of estimates of carbon dioxide concentrations in the atmosphere over the last 8 million years. Let's zoom in on this period years and see what happened to carbon dioxide compared with the sea level anomaly. Still no correlations. Anyone who still thinks that carbon dioxide has anything to do with temperature just has to look at the wild oscillations that occurred around three million years ago, the time the ice age normal was beginning. The graph of the 420,000 year temperature history above corresponds to roughly the section from 0.4 to 0.0 years BP. Image: ibid.
The argument for the relatively low-level constancy of the concentration of carbon dioxide during the massive temperature changes that took place in that 23 million year period is surely an argument for the essential feebleness of carbon dioxide as an influence on temperature.
If we zoom close in on the 11,000 years up to the present (the Holocene) we find no relationship at all between carbon dioxide and temperature:
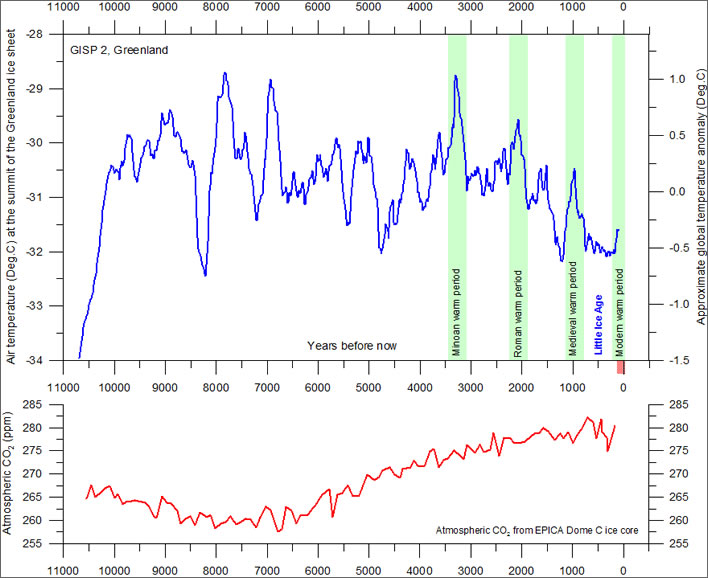
MeteoSwiss tells us that carbon dioxide concentrations hovered around 280 ppm for around 23 million years, which is (sort of) true. But, of course, they don't tell us what was happening to temperatures at the time. This graph relates to the 11,000 years of the Holocene. If you can see a correlation between temperature and the concentration of atmospheric carbon dioxide please send this information to MeteoSwiss – they will be very happy to hear from you! – and then make an appointment with an optician.
[Prof Humlum's caption] The upper panel shows the air temperature at the summit of the Greenland Ice Sheet, reconstructed by Alley (2000) from GISP2 ice core data. The time scale shows years before modern time. The rapid temperature rise to the left indicate the final part of the even more pronounced temperature increase following the last ice age. The temperature scale at the right hand side of the upper panel suggests a very approximate comparison with the global average temperature (see comment below). The GISP2 record ends around 1854, and the two graphs therefore ends here. There has since been an temperature increase to about the same level as during the Medieval Warm Period and to about 395 ppm for CO2. The small reddish bar in the lower right indicate the extension of the longest global temperature record (since 1850), based on meteorological observations (HadCRUT3). The lower panel shows the past atmospheric CO2 content, as found from the EPICA Dome C Ice Core in the Antarctic (Monnin et al. 2004). The Dome C atmospheric CO2 record ends in the year 1777. Image: Humlum, ibid.
The diagram above […] shows the major part of the present interglacial period, the Holocene, as seen from the summit of the Greenland Ice cap. The approximate positions of some warm historical periods are shown by the green bars, with intervening cold periods.
Clearly Central Greenland temperature changes are not identical to global temperature changes. However, they do tend to reflect global temperature changes with a decadal-scale delay (Box et al. 2009), with the notable exception of the Antarctic region and adjoining parts of the Southern Hemisphere, which is more or less in opposite phase (Chylek et al. 2010) for variations shorter than ice-age cycles (Alley 2003). This is the background for the very approximate global temperature scale at the right hand side of the upper panel. Please also note that the temperature record ends in 1854 AD, and for that reason is not showing the post Little Ice Age temperature increase. In the younger part of the GISP2 temperature reconstruction the time resolution is around 10 years. Any comparison with measured temperatures should therefore be made done using averages over periods of similar lengths.
During especially the last 4,000 years the Greenland record is dominated by a trend towards gradually lower temperatures, presumably indicating the early stages of the coming ice age. In addition to this overall temperature decline, the development has also been characterised by a number of temperature peaks, with about 950-1000 year intervals. It may even be speculated if the present warm period fits into this overall scheme of natural variations?
The past temperature changes show little (if any) relation to the past atmospheric CO2 content as shown in the lower panel. Initially, until around 7,000 years before now, temperatures generally increase, even though the amount of atmospheric CO2 decreases. For the last 7,000 years the temperature generally has been decreasing, even though the CO2 record now display an increasing trend. Neither is any of the marked 950-1000 year periodic temperature peaks associated with a corresponding CO2 increase. The general concentration of CO2 is low, wherefore the theoretical temperature response to changes in CO2 should be more pronounced than at higher concentrations, as the CO2 forcing on temperature is decreasing logarithmically with concentration. Nevertheless, no net effect of CO2 on temperature can be identified from the above diagram, and it is therefore obvious that significant climatic changes can occur without being controlled by atmospheric CO2. Other phenomena than atmospheric CO2 must have had the main control on global temperature for the last 11,000 years.
Humlum, ibid.
What the 'scientists' at MeteoSwiss who are attempting to educate us choose to leave out is that the warming effect of carbon dioxide – in so far as there is one – is logarithmic – as Professor Humlum also noted. If, for the sake of argument we take the climate sensitivity value (TCS) as 1.0, this means that the doubling from 200 to 400 ppm will add 1°C to the global temperature, the doubling from 400 to 800 ppm also 1°C, 800 to 1600 ppm likewise 1°C. According to MeteoSwiss's own figures, human emissions of carbon dioxide only account for 3% of total emissions, so if humans are to make their planet agreeably warm and its plantlife happy, they will have to step up their efforts considerably.
As for the propaganda – well, that's what they are paid to do. Did anyone ever think otherwise?
Readers who want some more background on carbon dioxide, temperature change and plant nutrition may find a recent piece by Dr Matt Ridley interesting.
Loyal readers of Figures of Speech will be all too aware that we have already churned over a number of CAGW matters in our plodding way, for example here, here, here, here, here, and here. To no effect whatsoever. Let's crack open that bottle of Norwegian champagne and see if that cheers us up.
Update 18.01.2018
The original version of this article used our English translations of the German texts on the MeteoSwiss 'Climate facts' webpage. There were only trivial differences between the two versions, but our English texts have now been replaced with the texts from the MeteoSwiss English version of the page, since these represent authentic MeteoSwiss statements. Some small changes in partial quotations had to be made to align with the new English texts.
Update 29.01.2018
The Neue Zürcher Zeiting today cannot conceal its shock that scientists working for an association founded and financed by German vehicle manufacturers, the nobly named Europäische Forschungsvereinigung für Umwelt und Gesundheit im Transportsektor (EUGT) used their scientific skills to demonstrate that the new diesels have healthier emissions than their predecessors. The research programme in question took place in 2015. In the course of it the scientists exposed not only monkeys to exhaust fumes but also humans.
The humans were gassed with diesel fumes in Germany, in the university hospital in Aachen to be precise. The monkeys got a similar treatment in the USA. Some of the subjects got the exhaust fumes from an old diesel, some from a new model.
Leaving aside the highly questionable ethics of such tests when completely reliable objective measures of emissions are easily available, the NZZ is shocked at the mendacity of the participating scientists:
What is particularly puzzling is that the automobile industry does not seem interested in pure scientific data but has instead misused research for its marketing interests. The EUGT had provided a test vehicle the emissions of which were manipulated to be especially low. It is as though one would test a drug that did not contain the active ingredient in order to show that the drug had no side effects. That is called scientific fraud.
Was dabei besonders irritiert: Die Autoindustrie scheint nicht an sauberen wissenschaftlichen Daten interessiert gewesen zu sein, sondern hat die Forschung für ihre Marketinginteressen missbraucht. So hat die EUGT für die Versuche in dem beauftragten Institut ein Testfahrzeug bereitgestellt, das aufgrund von technischen Manipulationen besonders wenig Schadstoffe ausstiess. Das ist, als würde man einen Medikamententest mit einem Präparat ohne Wirkstoff durchführen, um zu beweisen, dass das Mittel keine Nebenwirkungen hat. Das nennt man wissenschaftlichen Betrug.
Why should any rational person think that climate scientists are any different, supported as they are by immense sums of money from interested parties determined to prove a particular case?
Update 30.01.2018
A very tidy summary of the scientific arguments against the CAGW supposition appears in Watts Up With That today from contributor Javier. Here is the part dealing with climate sensitivity, but the entire article is worth a careful read.
Physics shows that adding carbon dioxide leads to warming under laboratory conditions. It is generally assumed that a doubling of CO2 should produce a direct forcing of 3.7 W/m2 [1], that translates to a warming of 1°C (by differentiating the Stefan-Boltzmann equation) to 1.2°C (by models taking into account latitude and season). But that is a maximum value valid only if total energy outflow is the same as radiative outflow. As there is also conduction, convection, and evaporation, the final warming without feedbacks is probably less. Then we have the problem of feedbacks that we don’t know and cannot properly measure. For some of the feedbacks, like cloud cover we don’t even know the sign of their contribution. And they are huge, a 1% change in albedo has a radiative effect of 3.4 W/m2 [2], almost equivalent to a full doubling of CO2.
So, in essence we don’t know how much the Earth has warmed in response to the increase in CO2 for the past 67 years, and how much for other causes. That is the reason why, after expending billions on the question of climate sensitivity to CO2, we have not been able to reduce the range of possible values, 1.5°C to 4.5° C[3], a factor of 3, in the 39 years that have passed since the Charney Report was published [4]. A clear scientific failure.
[1] IPCC TAR. http://www.ipcc.ch/ipccreports/tar/wg1/
[2] Farmer G.T., Cook J. (2013) Earth’s Albedo, Radiative Forcing and Climate Change. In: Climate Change Science: A Modern Synthesis. Springer, Dordrecht.
[3] IPCC AR5. http://www.ipcc.ch/report/ar5/wg1/
[4] Charney Report (1979). http://www.ecd.bnl.gov/steve/charney_report1979.pdf
Javier is using the 'range of possible values' presented by the IPCC, the representatives of the orthodoxy in climate science, to make his point, which does not contradict the point we made above, that measurements of CO2 sensitivity have trended over the years towards tiny values that have little if any influence on the grand scheme of things in the climate of the Earth.
0 Comments
Server date and time:
Browser date and time:
Input rules for comments: No HTML, no images. Comments can be nested to a depth of eight. Surround a long quotation with curly braces: {blockquote}. Well-formed URLs will be rendered as links automatically. Do not click on links unless you are confident that they are safe. You have been warned!